Proportion of land that is degraded over total land area
Last updated on 1 February 2022
This indicator is currently classified as Tier I. The United Nations Convention to Combat Desertification (UNCCD) is the Custodian agency for this indicator. Food and Agriculture Organization of the United Nations (FAO) and the United Nations Environment Programme (UNEP) are partner agencies.
Unit of measure: Proportion of land that is degraded over total land area (%)
Why is this indicator important?
Food production, extractive industries, or the expansion of infrastructure increase pressure on arable lands, pastures, forestry, and other essential areas. In turn, land degradation has negative effects on ecosystems, farm yields, and the quantity and quality of water resources. As a consequence, food insecurity may rise and facilitate migration and urbanization.
To assess the extent of land degradation is important for tracking progress towards voluntary Land Degradation Neutrality (LDN) targets and for the development of plans of action to redress degradation, including through the conservation, sustainable management, rehabilitation and restoration of land resources.
How is the indicator measured and monitored?
According to the metadata document, the indicator uses a binary classification (degraded or not degraded) drawing on the three sub-indicators that assess trends in land cover, in land productivity, and in carbon stocks above and below ground. Any significant decrease or negative change in one of the three is considered to compromise land degradation. Land degradation is defined the reduction or loss of the biological or economic productivity and complexity of rain fed cropland, irrigated cropland, or range, pasture, forest and woodlands resulting from a combination of pressures, including land use and management practices. (UNCCD 1994, Article 1).
Since 2018, data is collected every four years through UNCCD’s national reporting and review process. Data sources include databases, maps, reports provided by ministries or agencies along with national statistical offices, as well as remote sensing, such Earth Observation data sources, that are disaggregated to national level. The Good Practices Guidance for SDG Indicator 15.3.1, version 2.0 provides a detail overview on monitoring and computation. The main limitations include the availability of historical time series and the, as of yet, often limited national capacities to process, interpret, and validate geospatial data.
By Anne Hennings, peer-reviewed by UNCCD.
Official indicator data
The proportion of land that is degraded draws on three sub-indicators: Land productivity, land cover, and soil organic carbon.
* Select "year" below to see the most recent data for more countries.
Other related indicators on Land Portal
In addition to the official indicator data, the following indicators provide information concerning land under organic agriculture and the enforcement of land use restrictions in rural areas.
| Indicator | Min-Max Number of years |
Countries / Obs | Min / Max Value |
|---|---|---|---|
| Agricultural area certified organic | |||
| Agriculture area under organic agric. | |||
| Restrictions regarding rural land use are enforced |
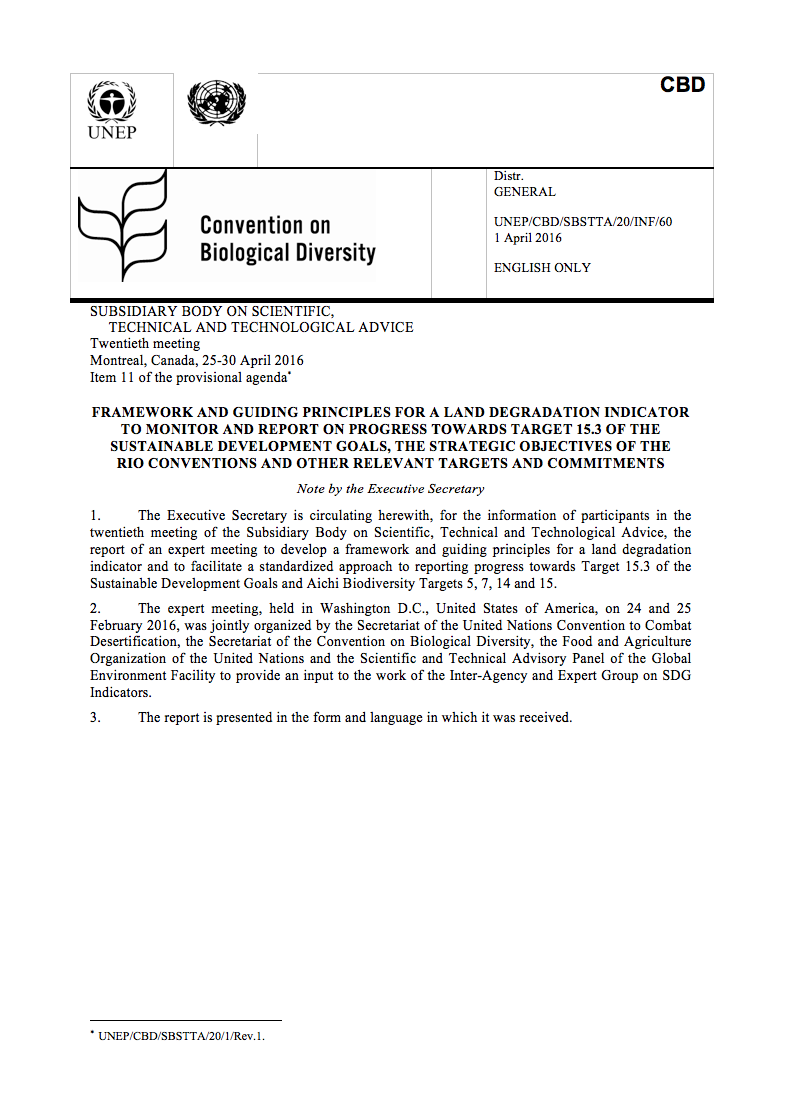
Framework and Guiding Principles for a Land Degradation Indicator
Framework and Guiding Principles for a Land Degradation Indicator to monitor and report on progress towards target 15.3 of the Sustainable Development Goals, the strategic objectives of the Rio Conventions and other relevant targets and commitments
COLOMBIA: RESTORING THE LAND, SECURING THE PEACE: INDIGENOUS AND AFRO-DESCENDANT TERRITORIAL RIGHTS
Forced displacement and the misappropriation of land, often through violence and intimidation, have been a defining feature of Colombia’s internal armed conflict. These human rights violations and abuses have targeted above all Indigenous, Afro-descendant and peasant farmer communities.
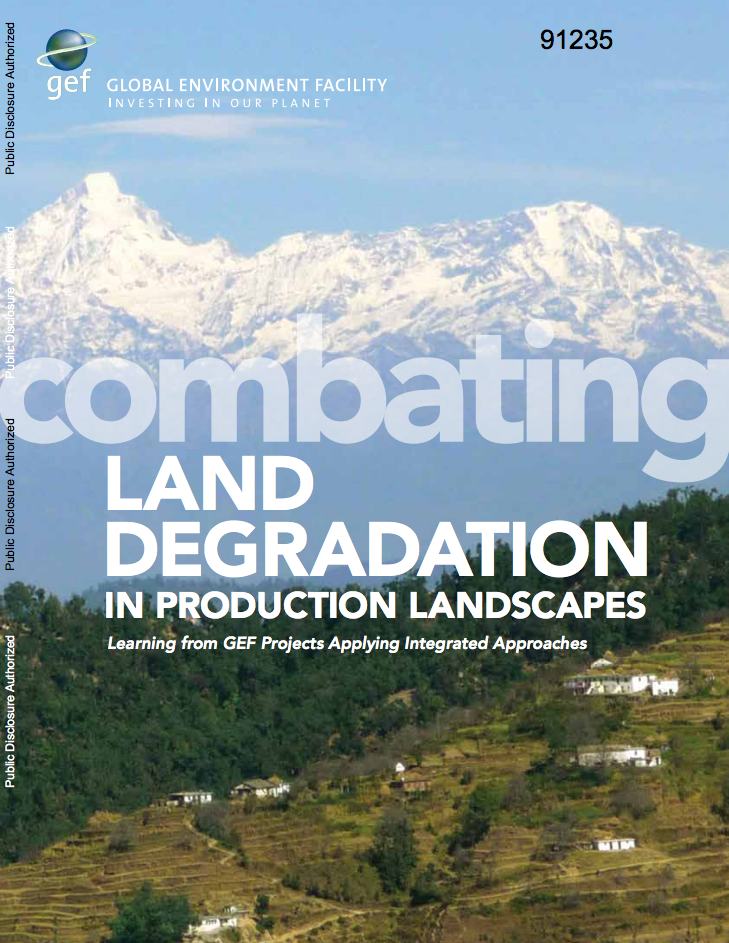
Combating Land Degradation in Production Landscapes : Learning from GEF Projects Applying Integrated Approaches
During the Fifth Replenishment Phase of
the Global Environment Facility (GEF-5), portfolio
monitoring and learning review were introduced as key
components of knowledge management in the GEF Secretariat.
These strategies were intended to address the need to
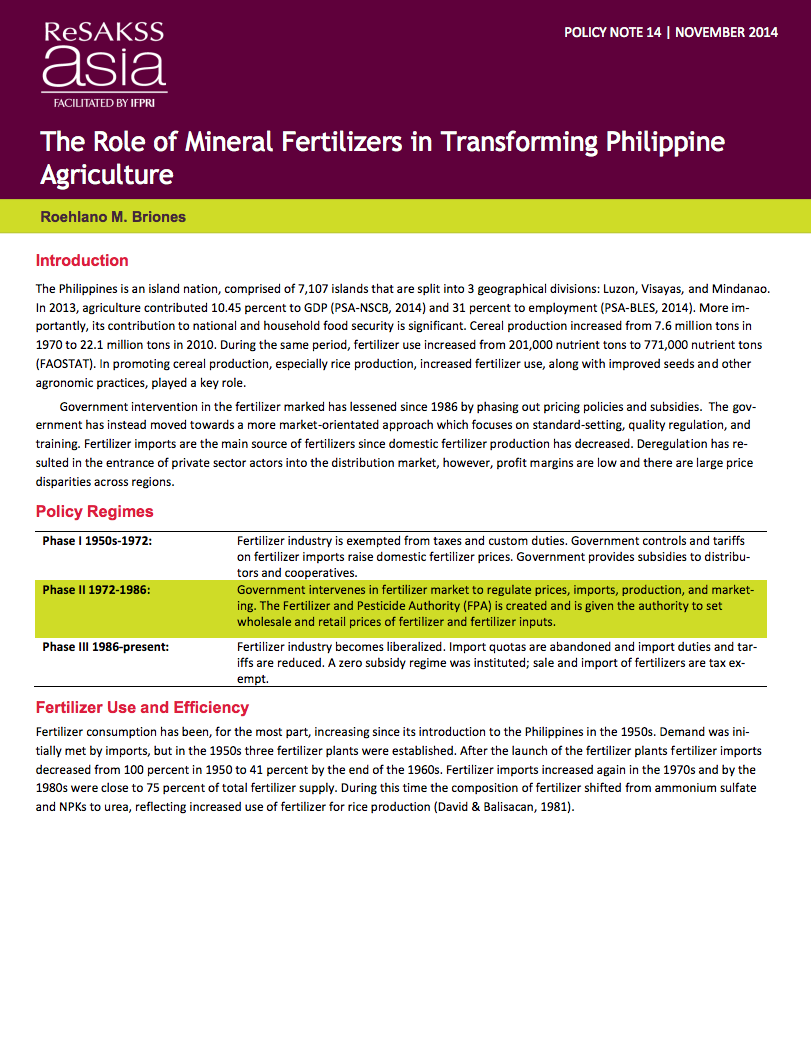
The role of mineral fertilizers in transforming Philippine agriculture
The Philippines is an island nation, comprised of 7,107 islands that are split into 3 geographical divisions: Luzon, Visayas, and Mindanao. In 2013, agriculture contributed 10.45 percent to GDP (PSA-NSCB, 2014) and 31 percent to employment (PSA-BLES, 2014). More im-portantly, its contribution to national and household food security is significant.
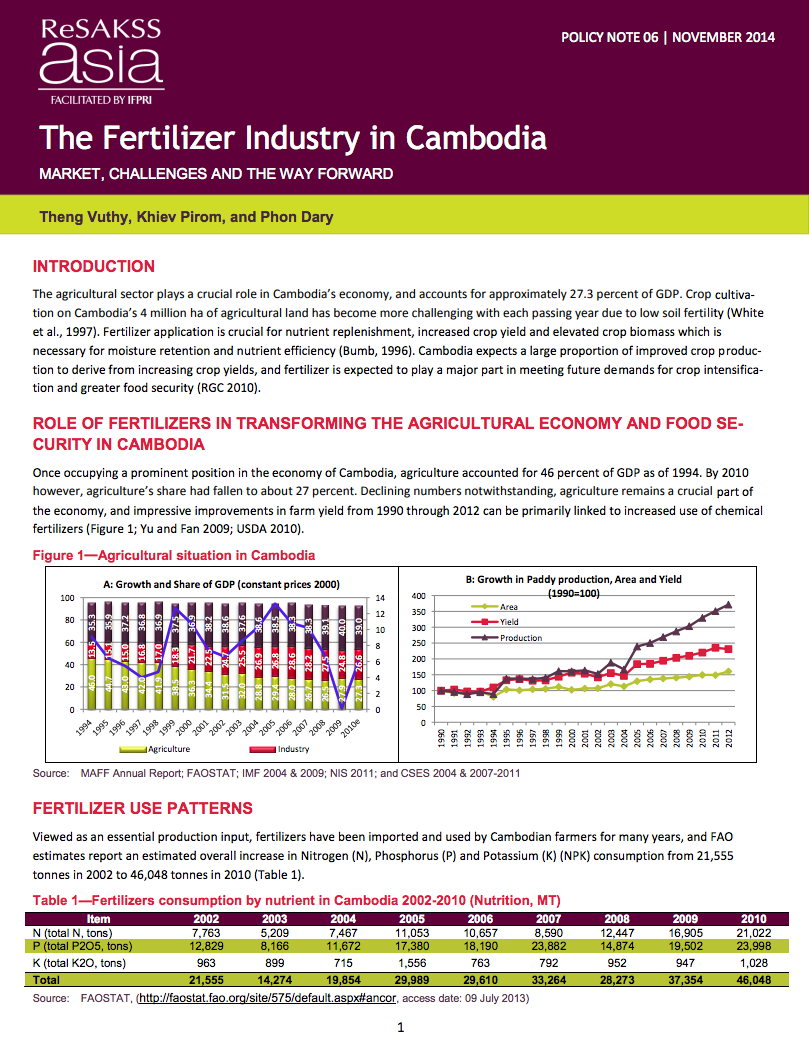
The fertilizer industry in Cambodia: Market, challenges and the way forward
The agricultural sector plays a crucial role in Cambodia’s economy, and accounts for approximately 27.3 percent of GDP. Crop cultiva-tion on Cambodia’s 4 million ha of agricultural land has become more challenging with each passing year due to low soil fertility (White et al., 1997).
Pagination
Educate to preserve the soil and conserve life on earth
Source: FAO
The XX Latin American Congress and XVI Peruvian Congress of Soil Science will be held in Cusco, Peru.
From 9 November to 15 November 2014.
Pagination
- Previous page ‹ previous
- Page 5
![]()

By 2030, combat desertification, restore degraded land and soil, including land affected by desertification, drought and floods, and strive to achieve a land degradation-neutral world
Indicator details
The Indicator is conceptually clear, has an internationally established and available methodology and standards, and that data is regularly produced by countries for at least 50 per cent of countries and of the population in every region where the indicator is relevant.
Key dates:

